
Over the past month, I signed up for a bunch of marketing emails.
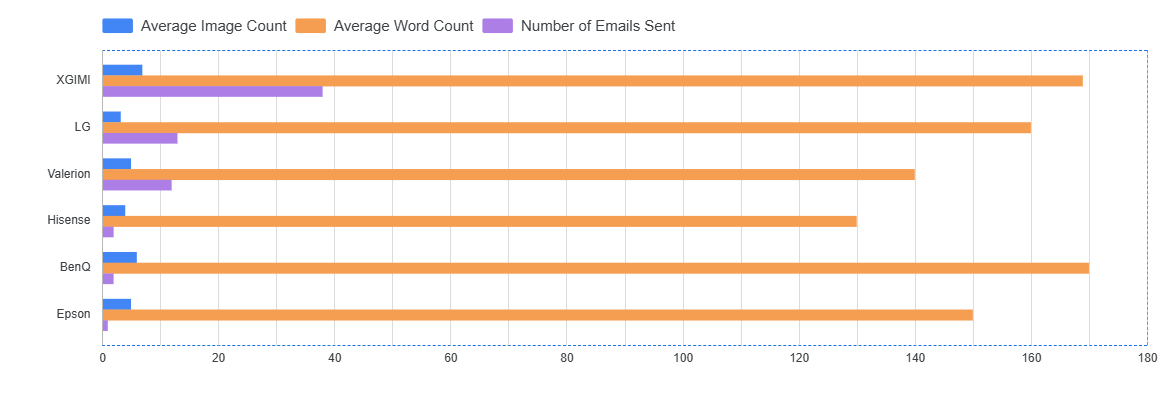
For my experiment, I signed up for emails from as many projector companies as I could find. I ended up with 6 projector brands(LG, BenQ, Epson, Xgimi, Valerion, and Hisense). I looked at every possible non-performance metric/dimension I could come up with to help evaluate what each brand was creating emails and what macro trends would show in the dataset. Here are my findings.
Start with the Basics
Email Sign Up Forms
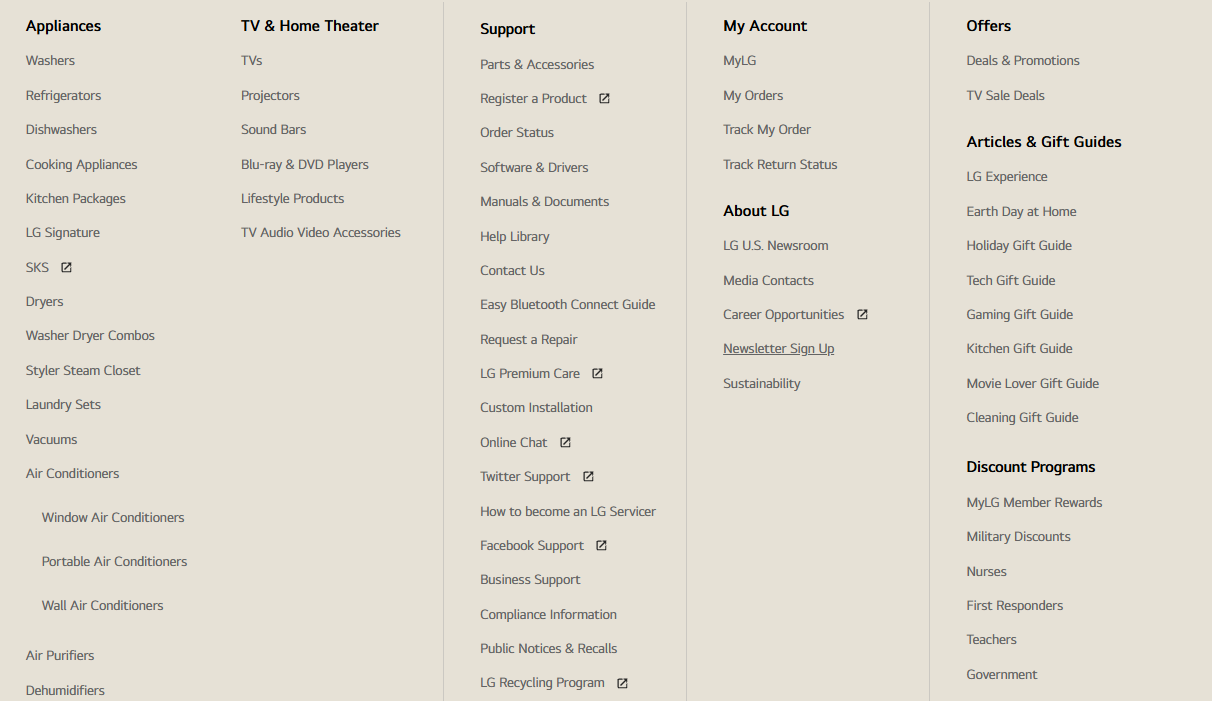
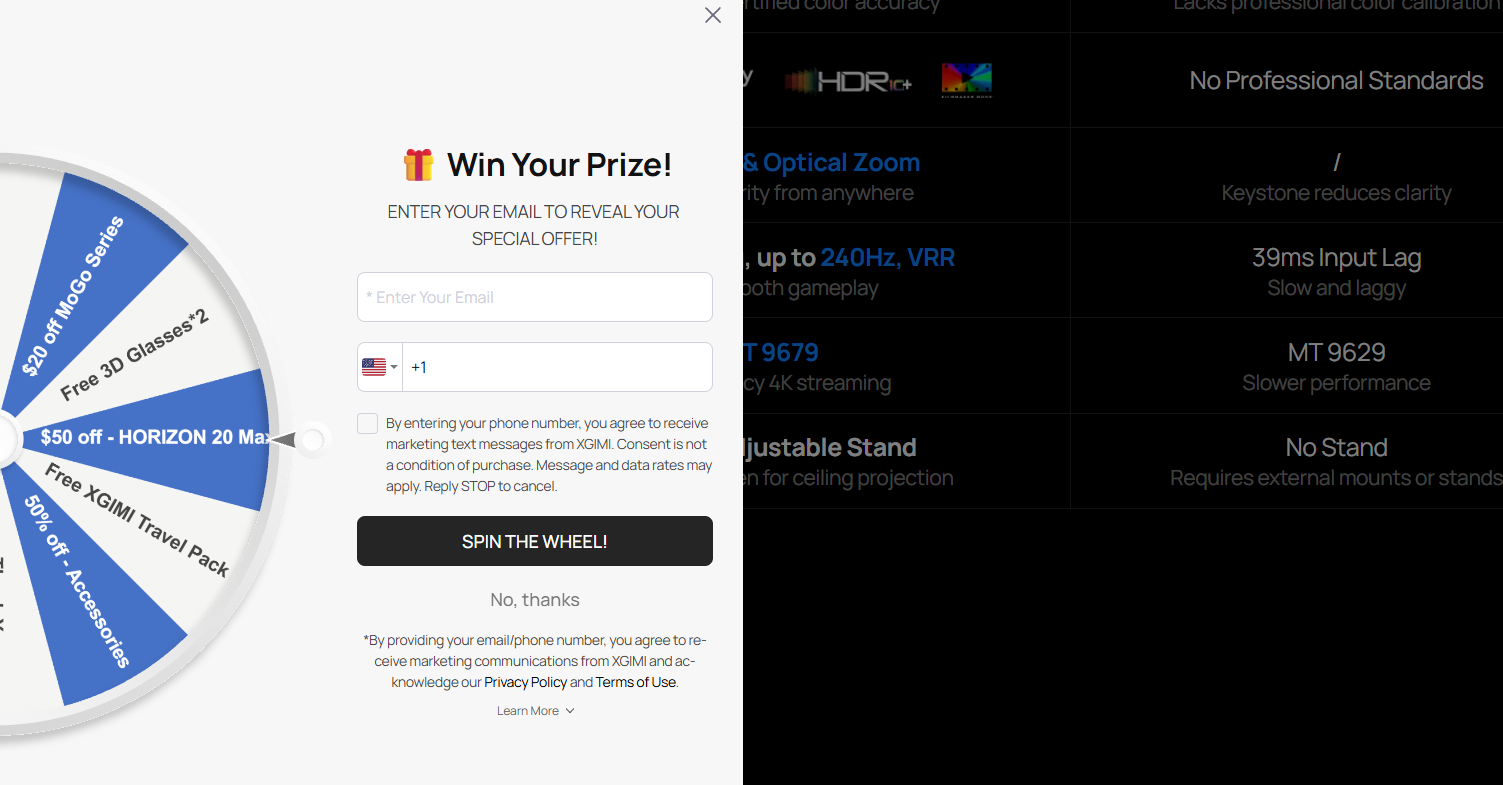
Only 2 brands had easy-to-find sign-up forms. BenQ, I had to search for an email/newsletter sign-up. LG also hid its email sign-up in the footer, making it hard for users to find. Xgimi even showed a pop-up after the user spent more than a few seconds on the page. It was interesting to see smaller brands have a more visible email CTA than larger brands.
LG Email Sign Up Location
Xgimi Email Pop Up
Monitor and Resolve Spam Delivery Issues
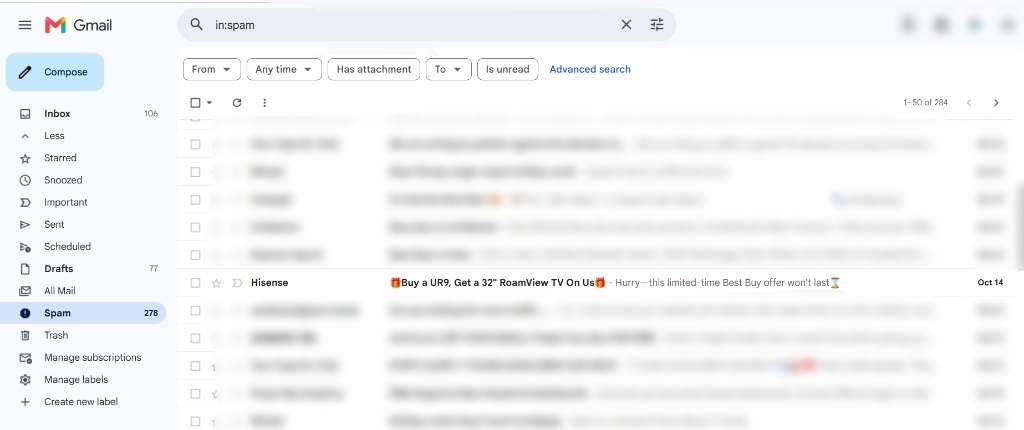
Hisense’s marketing went directly to my spam folder when I signed up for their marketing outreach emails. Always monitor your email deliverability across a wide range of services including Gmail and Outlook.
Larger The Brand The Worse The Segmentation
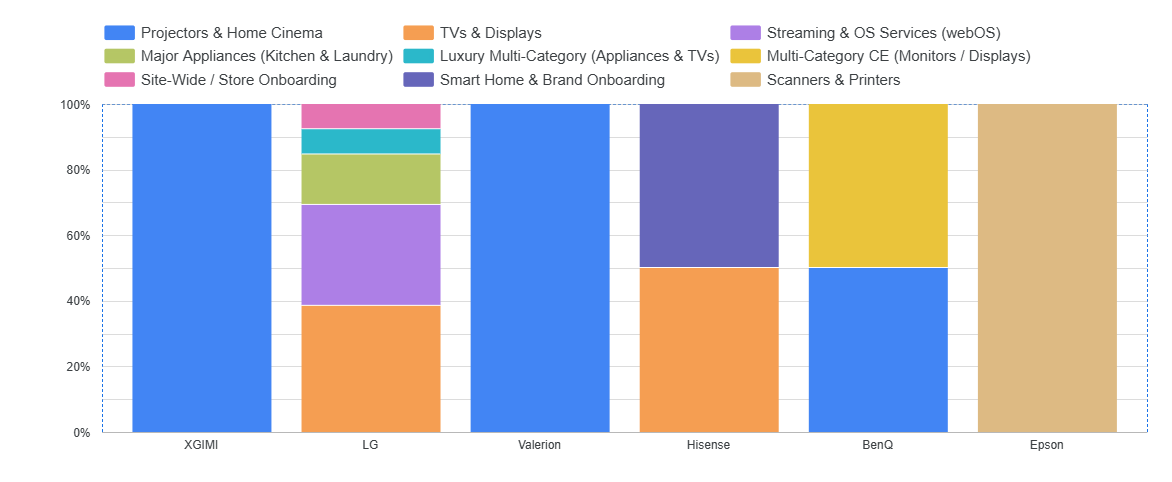
Large brands struggled with segmentation; for example, LG and Hisense sent marketing emails about products ranging from refrigerators to TVs. Smaller projector-only brands such as Xgimi and Valerion sent only projector-related emails. While projector-only brands can more easily target one product line, larger brands often have bigger marketing teams to support a product line.
Subject Lines Are the Key to Club
I saw an interesting YouTube video on marketing for YouTubers by Kate Tolo on knowing your ticket price. This is actually were my original idea for this study started. Your email subject line is your ticket into the club, if it’s compelling enough to get that open.
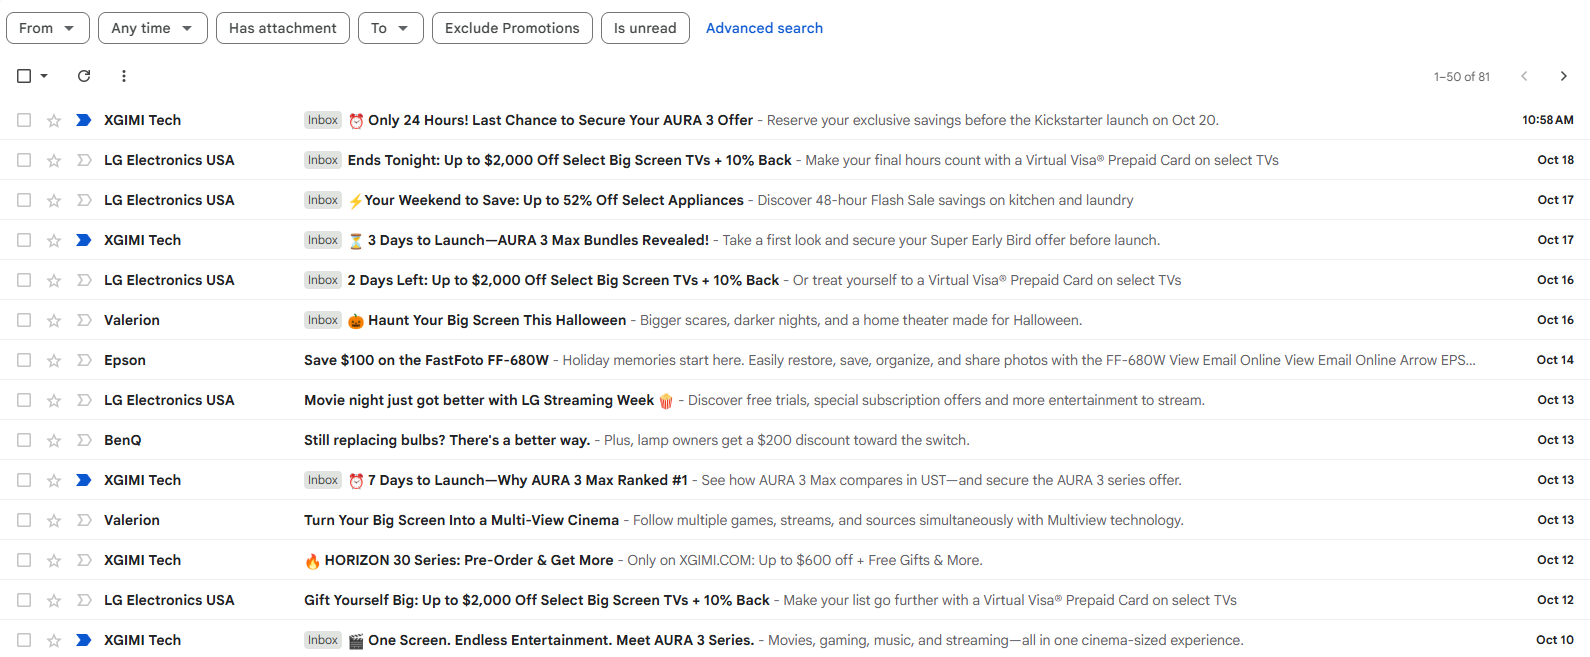
Across my data, 56.4% of subject lines focused strictly on direct promotion or urgency (21 Promotional, 10 Urgency), while only 10.9% (6 sends) delivered educational content. Brands mostly spoke to their audiences from two extremes, blasting technical specifications (“Dual Dynamic Iris, RGB Triple Laser, 5,700 ISO Lumens, 8,000:1 Native Contrast”) or pushing discounts or deals (“Up to 37% Off”, “48 HOURS LEFT”, “Last Chance”). No brand invested in actually humanizing the product, no user home theater transformations, room layout guides, real-world throw-distance problem-solving, or community threads.
Over 50% of Xgimi’s emails included an emoji in the subject line, trying to stand out in Gmail’s Promotions tab. XGIMI and BenQ average 160–170 words with 6–7 images, relying heavily on modular, poster-style image blocks. LG emails lean more heavily on HTML text (averaging only 3 images per send).
CTAs Need to Be Easy to Find, but Used Sparingly
XGIMI averaged nearly 5 distinct CTA buttons and 17+ links per email. In sale emails, they pasted identical Buy Now > buttons under 6 to 8 different projectors in a vertical grid, creating decision paralysis.
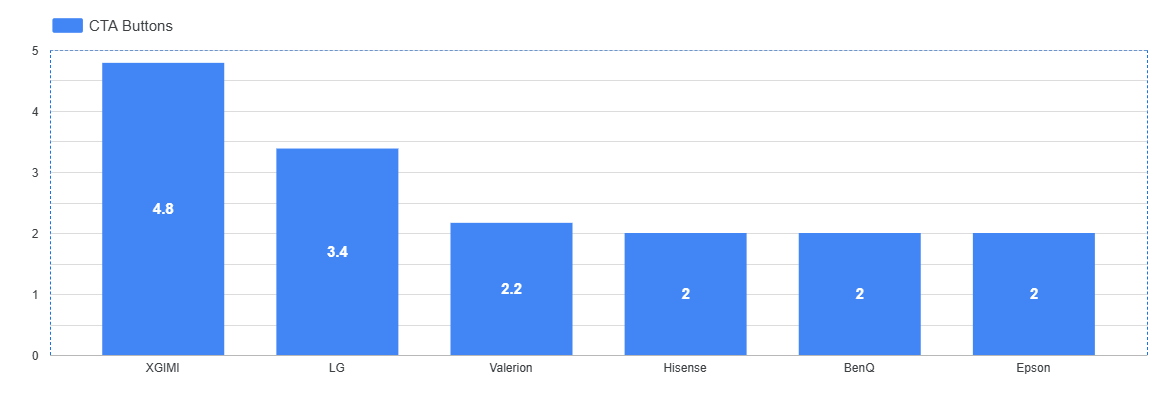
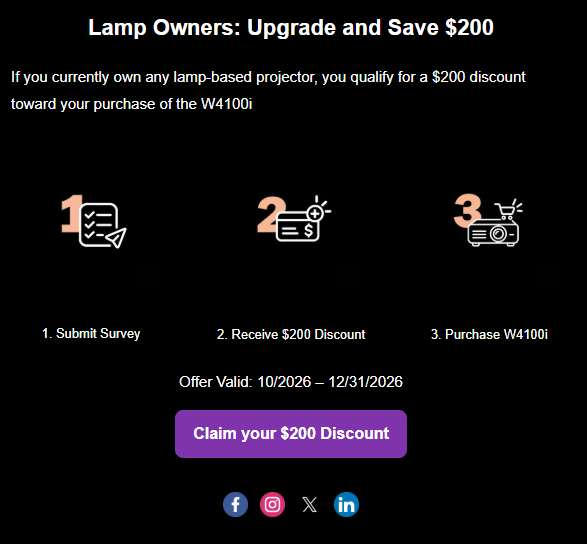
BenQ focused on 1-2 targeted CTAs. Instead of generic “Shop Now” links, BenQ tackled a real customer maintenance headache with a specific trade-in CTA: Claim $200 Lamp-to-Laser Trade-In. Valerion took a different approach by using images for most of the text, buttons, and images to have better control over the appearance of the emails.
BenQ CTA Button Example
Xgimi CTA Button Example
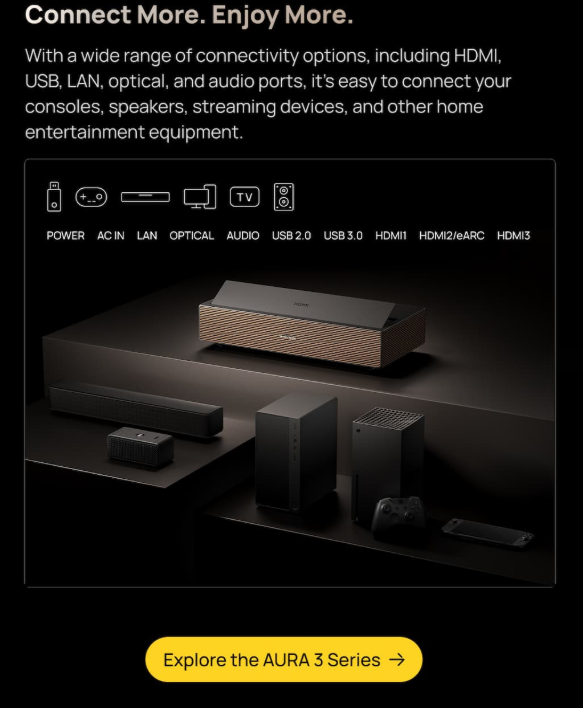
Valerion CTA Button Example
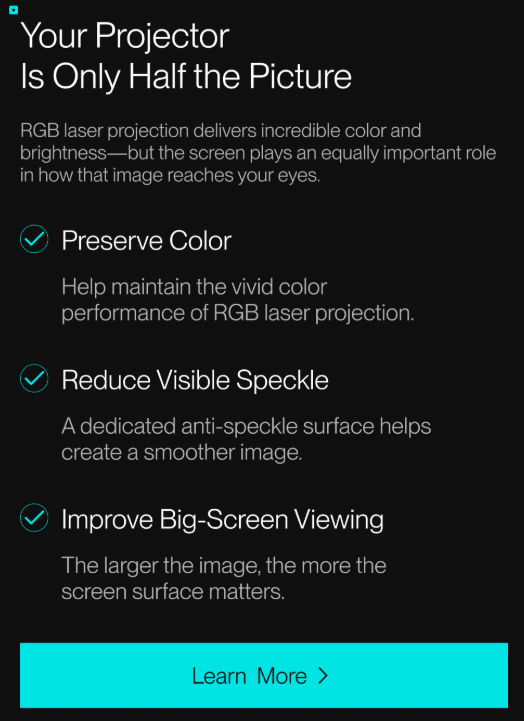
Final Thoughts:
As organic traffic continues to evolve, email marketing remains a staple of any brand’s outreach tactics. For brands, product segmentation at the email level can easily boost outreach performance by letting you target users more effectively. A clever, unique subject line should always be a priority for brands looking to gain an edge in consumers’ inboxes. Blasting 8 ‘Buy Now’ buttons in a single email turns your newsletter into a confusing digital flyer. The highest-intent emails gave the reader exactly one path forward and handled objections right inside the button copy.
Key Stats:
- Avg Word Count: 161 words
- Avg Images / Links: 6 images | 15 hyperlinks
- Top Share of Voice: XGIMI (38 sends / 55% of inbox volume)
- Promotional / Urgency vs. Educational: 56% vs. 11%
Disclaimer: All insights are based on speculation and data collected from the user side. I’m missing a large part of the puzzle because I don’t have performance data tied to the insights.


Leave a Reply